Axes
Through this panel it is possible to set the property of the axes shown in the 3D scene (Figure 40).

Figure 40 “Axes” panel tools
Visible
Allows to show the axes or not, depending on checking the box.
Transparency
Allows the user to set the transparency of the axes. When the slider is totally at left the object is completely visible, when it is on the right it is not visible at all. At intermediate positions it is more transparent as the slider goes towards the right.
X Y Z Axis name
Allows to rename each axis (X(m), Y(m), Z(m) are the default names), as it is shown in Figure 41.

Figure 41 Detail of “Axes” panel
All X Y Z Axis
Sets the visibility of each single axis, independently from the others two., e.g. in the Figure 42 the Z axis is visible in the first and not visible in the second case.

Figure 42 In A all the three axes are visible, in B the Z axis is not visible
X Y Z Title
Sets the visibility of each single axis title independently from the others two, e.g. in Figure 43 the title of the X axis is visible in the first and not in the second case.
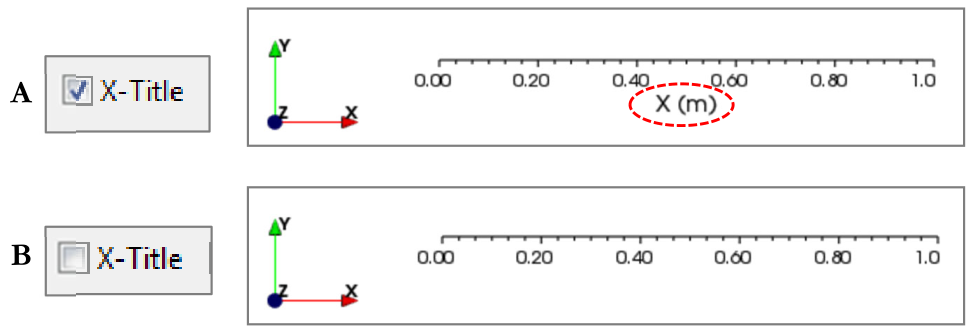
Figure 43 In A the title is visible, in B not
X Y Z Label
Sets the visibility of each axis labels independently from the others two, e.g. in Figure 44 the labels of the X axis are visible in the first and not in the second case.

Figure 44 In A all the X axis value (labels) are visible, in B they are not visible
Object Type
This pop-up menu sets the behaviour of the axes when the object is moved, letting the user choose between three options:
Outer Edges: This puts the axes along the outer edges of the object in the scene (the cube in the example) and they maintain this position even if the object is moved (they are not linked to the object), as shown in Figure 45.
Closest Triad: This puts the axes along the nearest triad from the point of view of the observer and they maintain this position even if the object is rotated (they are not linked to the object), as shown in Figure 45.
Fixed: This puts the axes in a fixed triad (starting from the Xmin, Ymin, Xmin) which is hooked to the object; if the object is rotated the axes rotates with it (Figure 45).

Figure 45 Before (left columns, A1, B1, C1) and after (right columns, A2, B2, C2) a rotation of the object. Only in the “closest Triad” case the axes do not follow the cube
Colour
Allows to change the colour of the axes; some examples are shown below (Figure 46).

Figure 46 Different choices for axes colours
Number of digits
Allows to set the number of decimals of the axes labels shown. It is possible to specify the value both graphically, with the “slider”, or numerically, using the text box.
As an example, in the following figure the number of digits is set to 2 and 4, respectively.

Figure 47 Example of different numbers of digits
Size of labels
Selects the font size of the numbers near the axes, specifying graphically the value through the “slider” or by numerically editing the text box (Figure 48).

Figure 48 Example of different labels sizes
Auto Fit
Auto Fit Live: If this is selected, the software automatically and continuously adjusts the size of the axes according to the size of object shown in the 3D figure (Figure 49).
Auto Fit now: This function has the same functionality as the checkbox above, but it works only one time when the button is pressed (Figure 49).

Figure 49 In A the axes does not fit the object, in B they follow the object because “Anti Fit live” or “Auto Fit Now” tool is active
Table
The table in the lower part of the screen allows to set the dimensions of the 3 axes and the way to display them. The following examples shows some customization possibilities. In this case (Figure 50), the axes are set in automatic way, through the Auto Fit Live tool, so the minimum and maximum dimensions of the axes are the same as the object.

Figure 50 Example of axes with “Auto fit Live” tool activated
It is possible to change the axis length, e.g. in Figure 51 the X axis starts from -1.5 and ends at +1.5, while the object size is still between -1 and +1.

Figure 51 Example of axis longer than the object
It is possible to change the features of axes labels as well. It is possible to set the Step (how many digits to skip between one label and the next) or the Ticks (how many labels to display). The two quantities are dependent on each other, so setting one of them ERTLab Studio/ViewLab3D will calculate automatically the other one (greyed out numbers in the table). In the example in Figure 52 the X axis Step is set at 0.25 and the Step of Y and Z axis are not modified (they are still at 0.5); the Ticks are automatically calculated, and it is 9. On the right hand the Ticks of the X label are set to 3 instead, still 5 for the Y and Z axis. The Step is now automatically calculated, and it is 1.

Figure 52 Examples of different Step (A) and Tick (B) of the X axis